Google PageSpeed Insights for WordPress
PageSpeed Insights is a tool developed by Google that leverages their Lighthouse application. More specifically, it collects the data loaded on a page and creates various audits. These audits are each given a different weight, based on Google’s predetermined page impact, and added together to create an overall Performance Score.
WP Engine now makes it easy to see current and past Google PageSpeed scores in the User Portal, along with recommendations for performance improvements.
Performance Page
View a website’s recent Google PageSpeed scores in the WP Engine User Portal by visiting the Performance page.
The performance scores and metrics shown on this page are specific to the individual environment selected.
Only Production environments with a live domain can have their PageSpeed scores viewed. Scores will update automatically every 1-3 days, and cannot be updated manually.
Lighthouse Performance data will update every day for sites with Page Speed Boost and every third day for sites without Page Speed Boost.
- From the Sites page, select an environment name
- Click Performance in the secondary lefthand menu (You may have to expand the Insights dropdown section)
- Click on the Google Lighthouse tab.
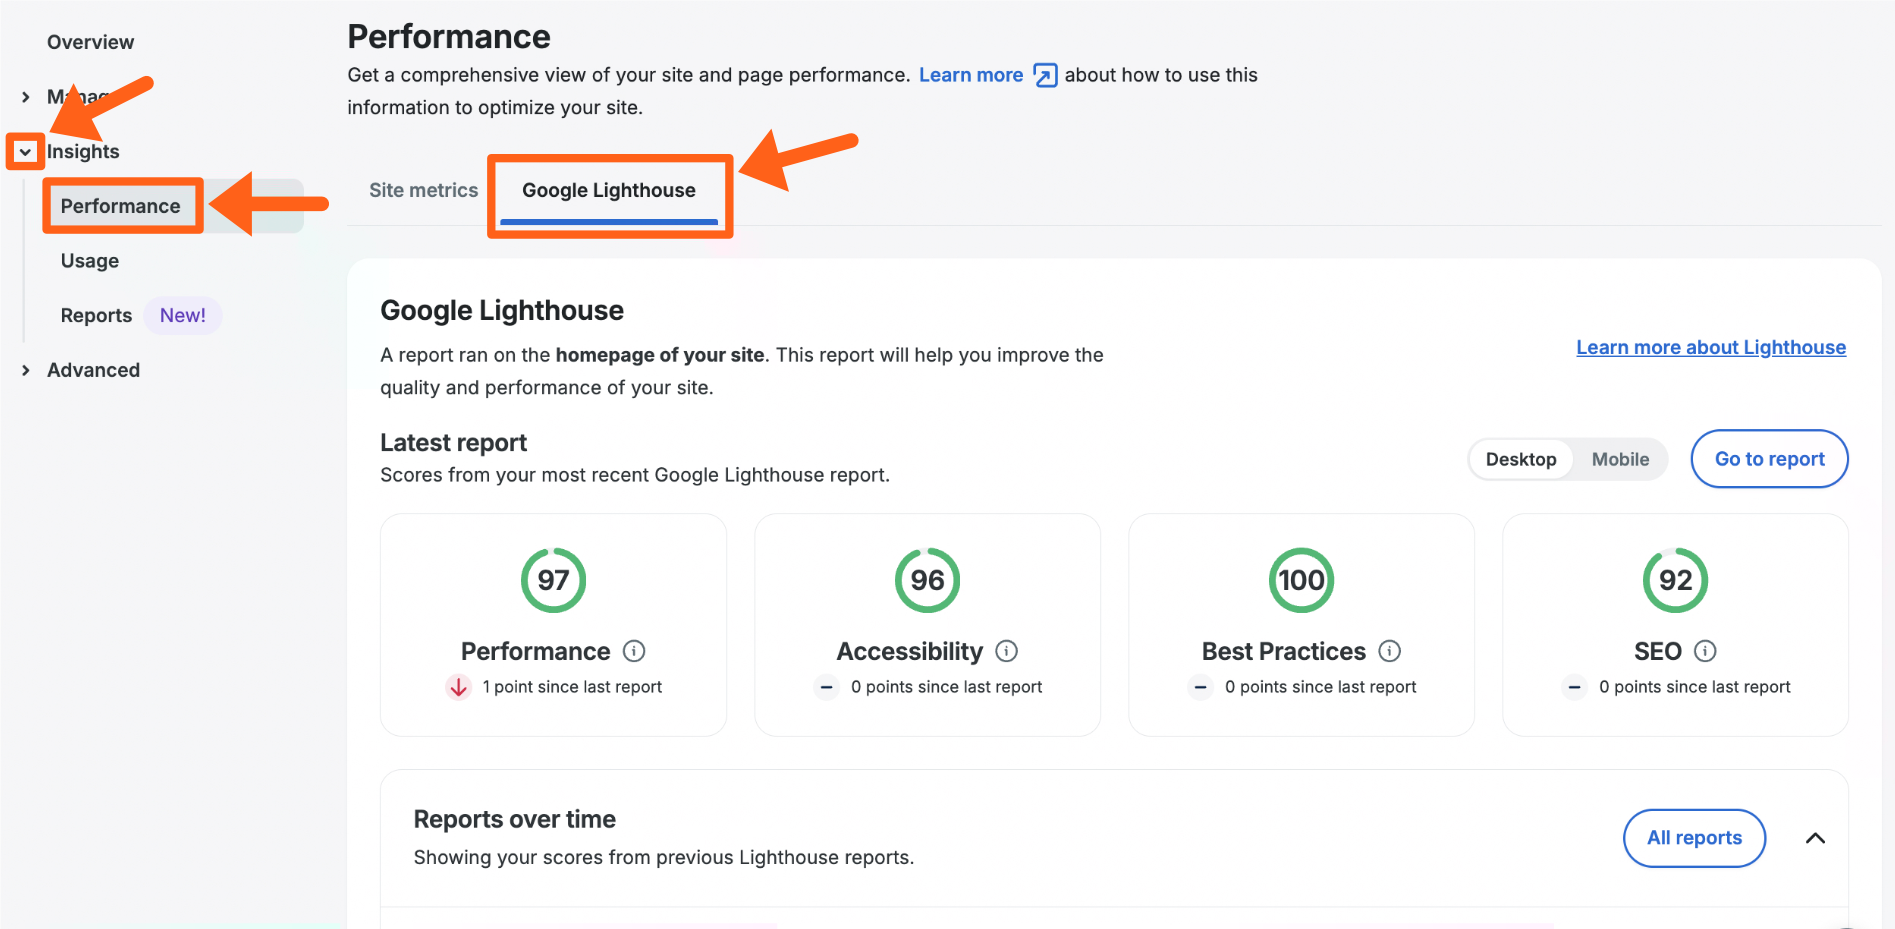
WP Engine breaks down scores into four categories:
- Performance: Overall performance score.
- Accessibility: Based on the website’s adherence to accessibility guidelines.
- Best Practices: How the website adheres to generally accepted best practices.
- SEO: How well the website is optimized for search engines.
To view more details about the scores from the most recent report, click on the Go to report button in the top right.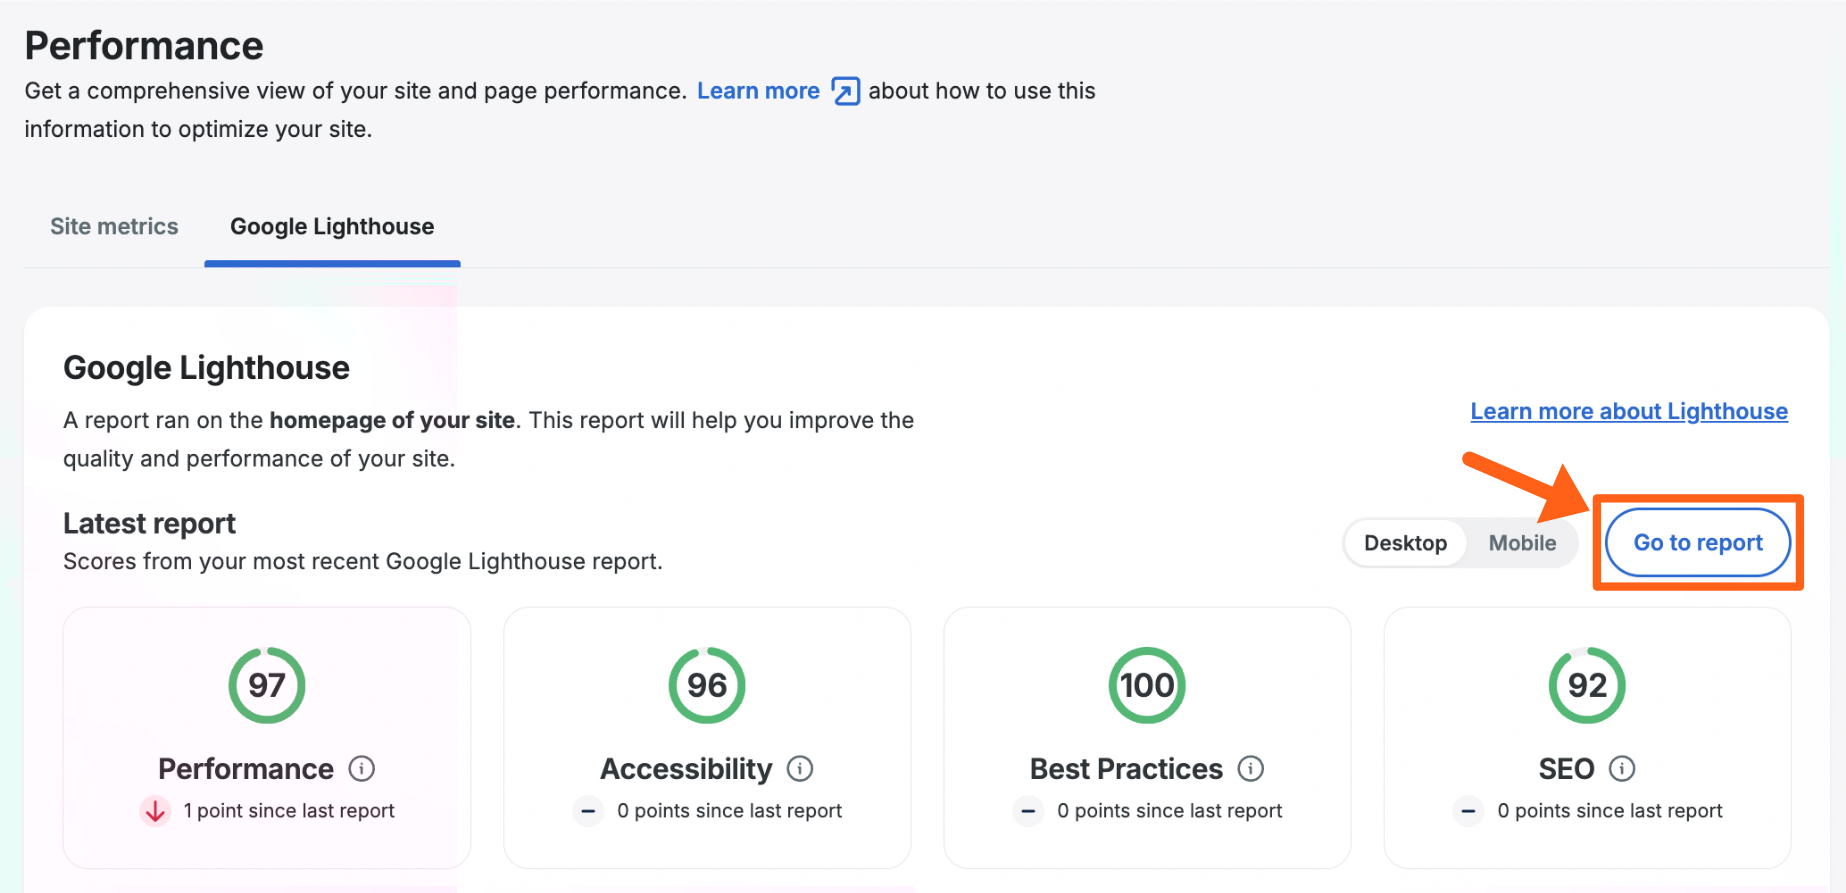
Each report will include:
- Detailed Performance Information: More information on these items can be found below.
- Performance Opportunities: Recommendations from WP Engine to help improve performance in certain areas, such as minimizing code or compressing images.
- For more information on performance optimization, see “How To Speed Up WordPress® Sites”.1
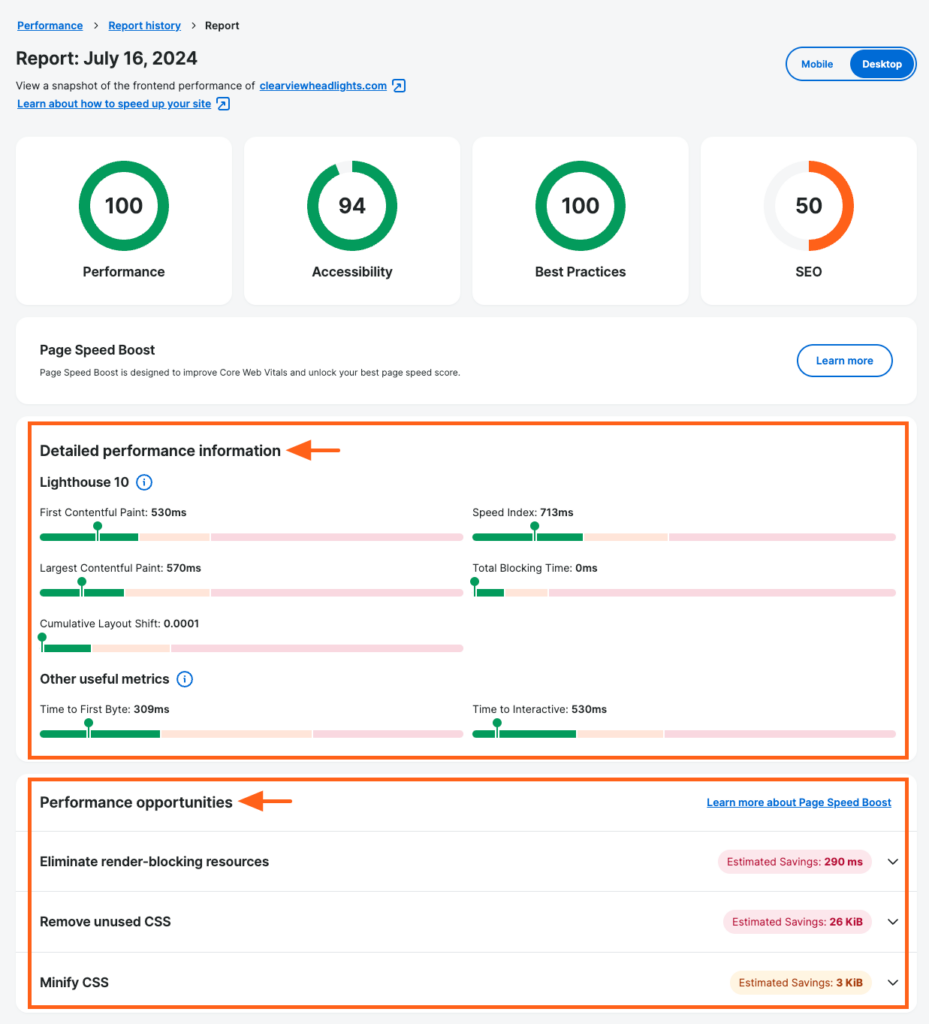
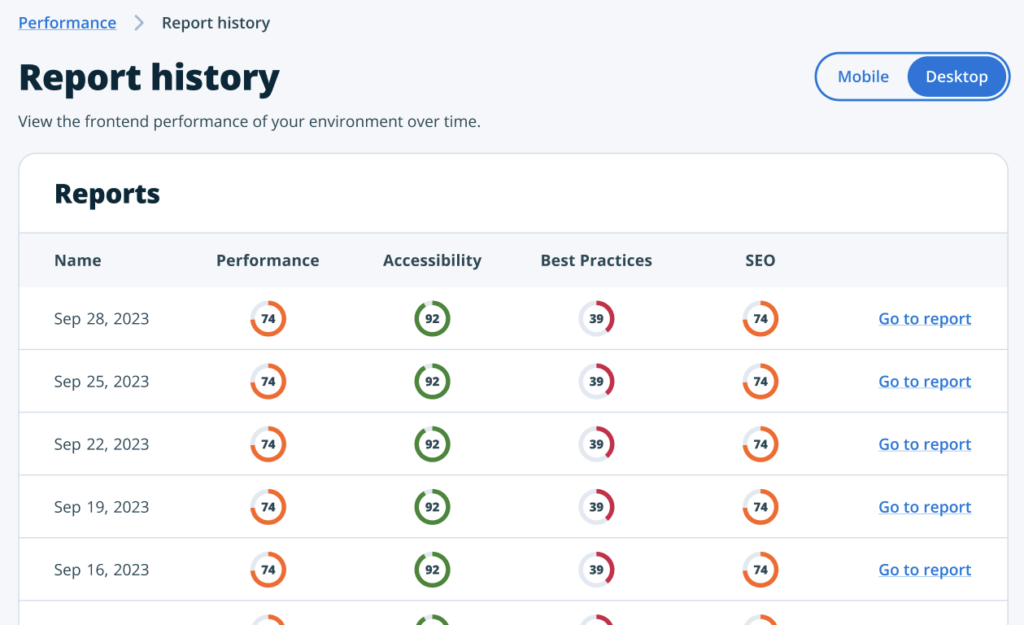
To view the history of past reports, scroll down to the Reports over time section and click the All reports button.
You will see a list of reports by date and you can click Go to report on the right to view each individual report.
Lighthouse Scores Overview
We’ve added a new page that shows an overview of Google Lighthouse scores for all of the environments on an account along with an option to download the report.
To see the overview page select Performance from the Insights menu in the main sidebar, and then select Google Lighthouse in the secondary lefthand menu.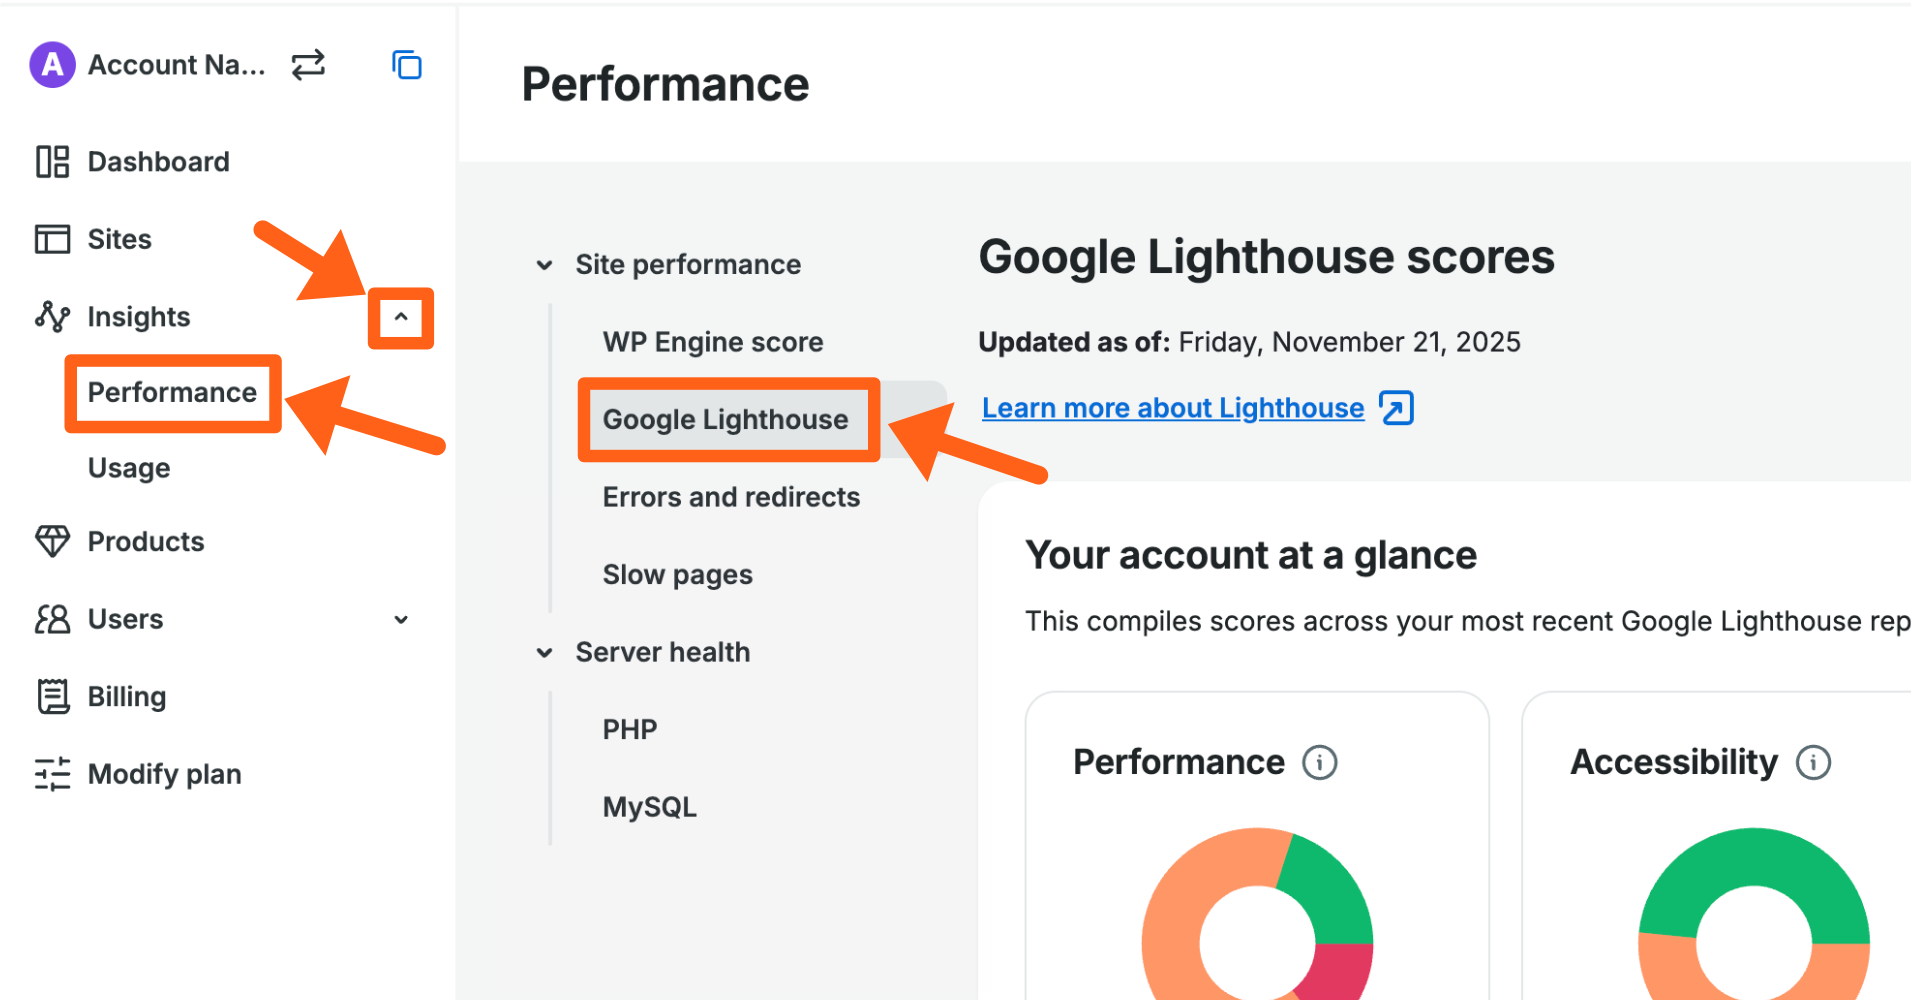
You can also view the overview page by clicking the See full list link in the Lighthouse performance section of the Dashboard.
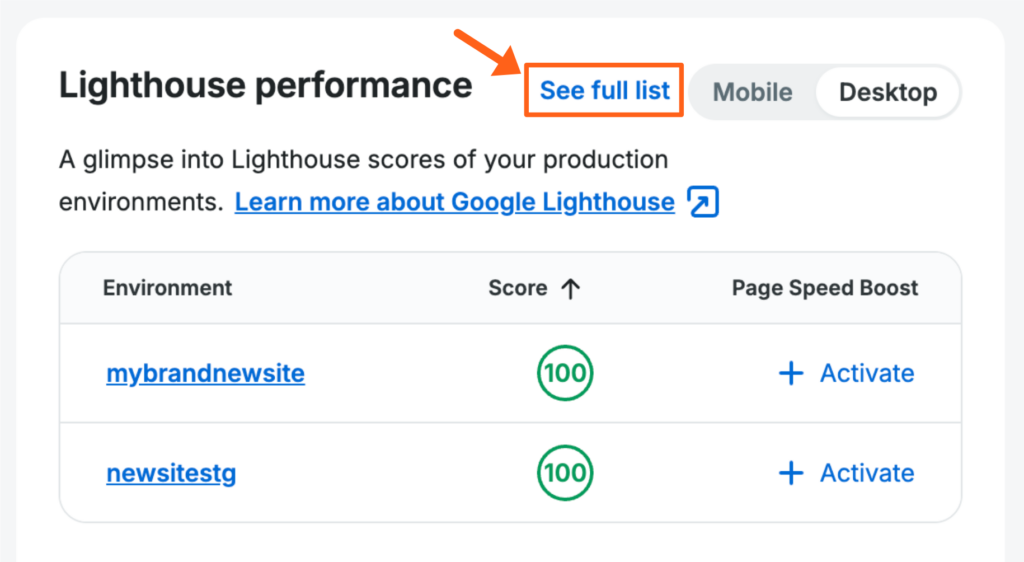
Lighthouse scores are updated every 1-3 days for an environment when data is available. The date column shows the date when the score was last calculated.
To toggle Mobile or Desktop scores, or Download the report use the buttons above the table to the right.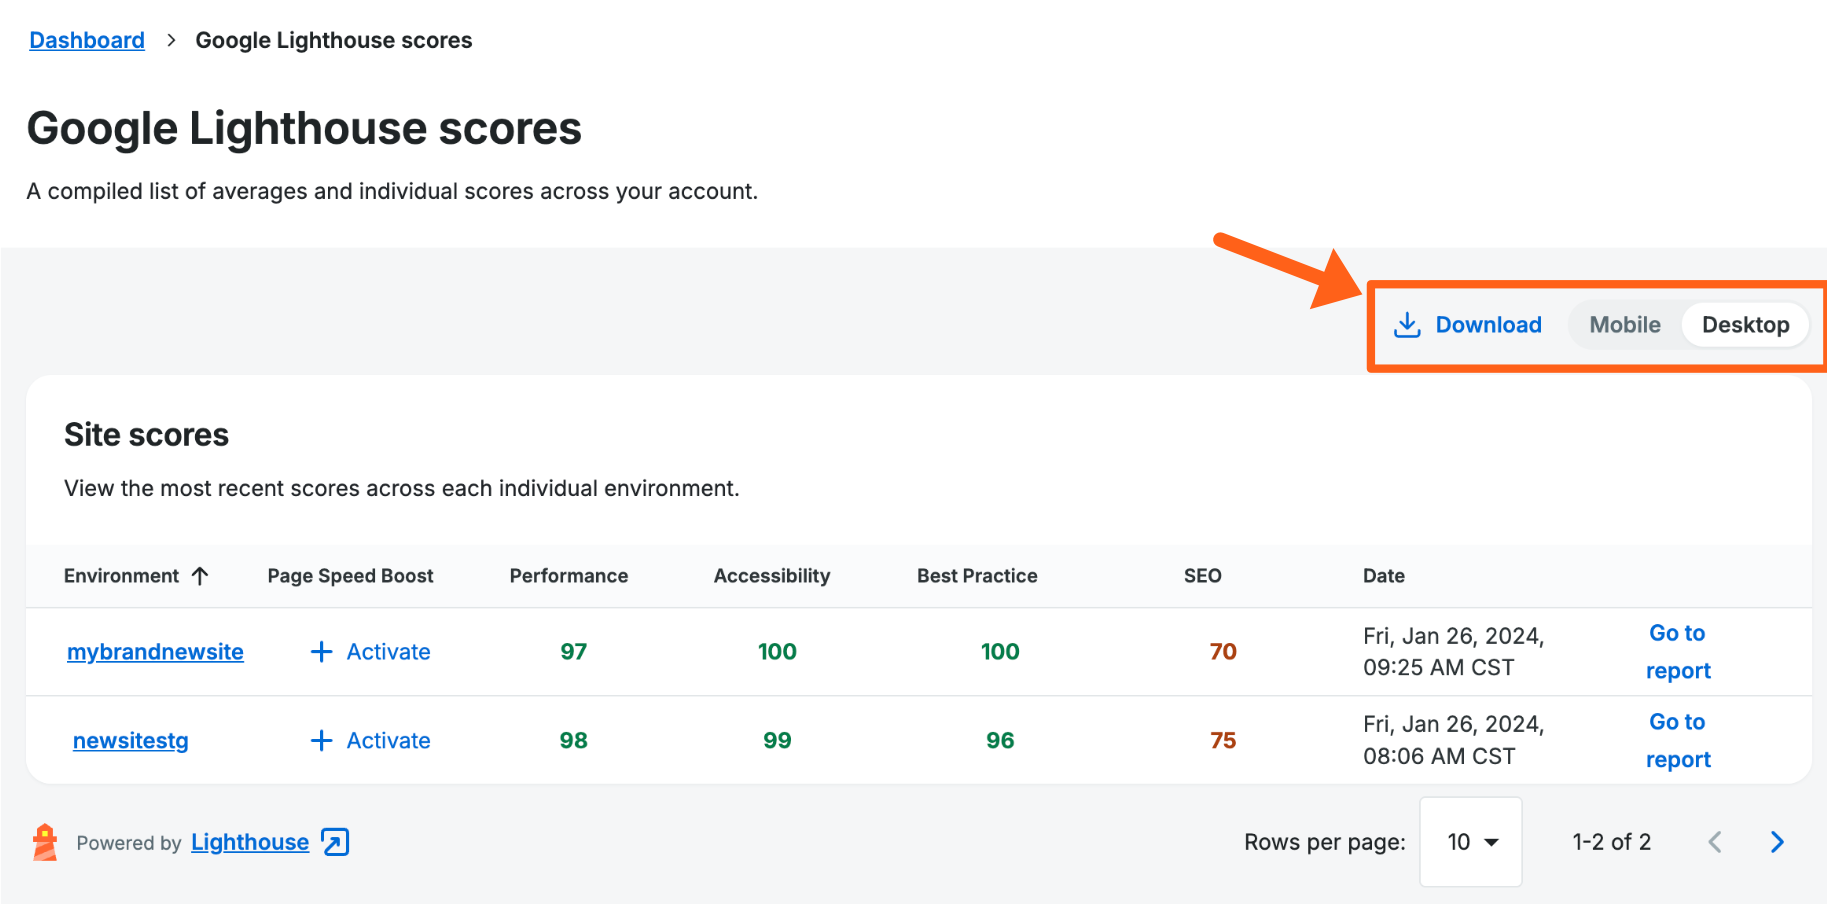
Sort columns
When a column title has an arrow next to it on hover, you can click the column title to sort the table by that column.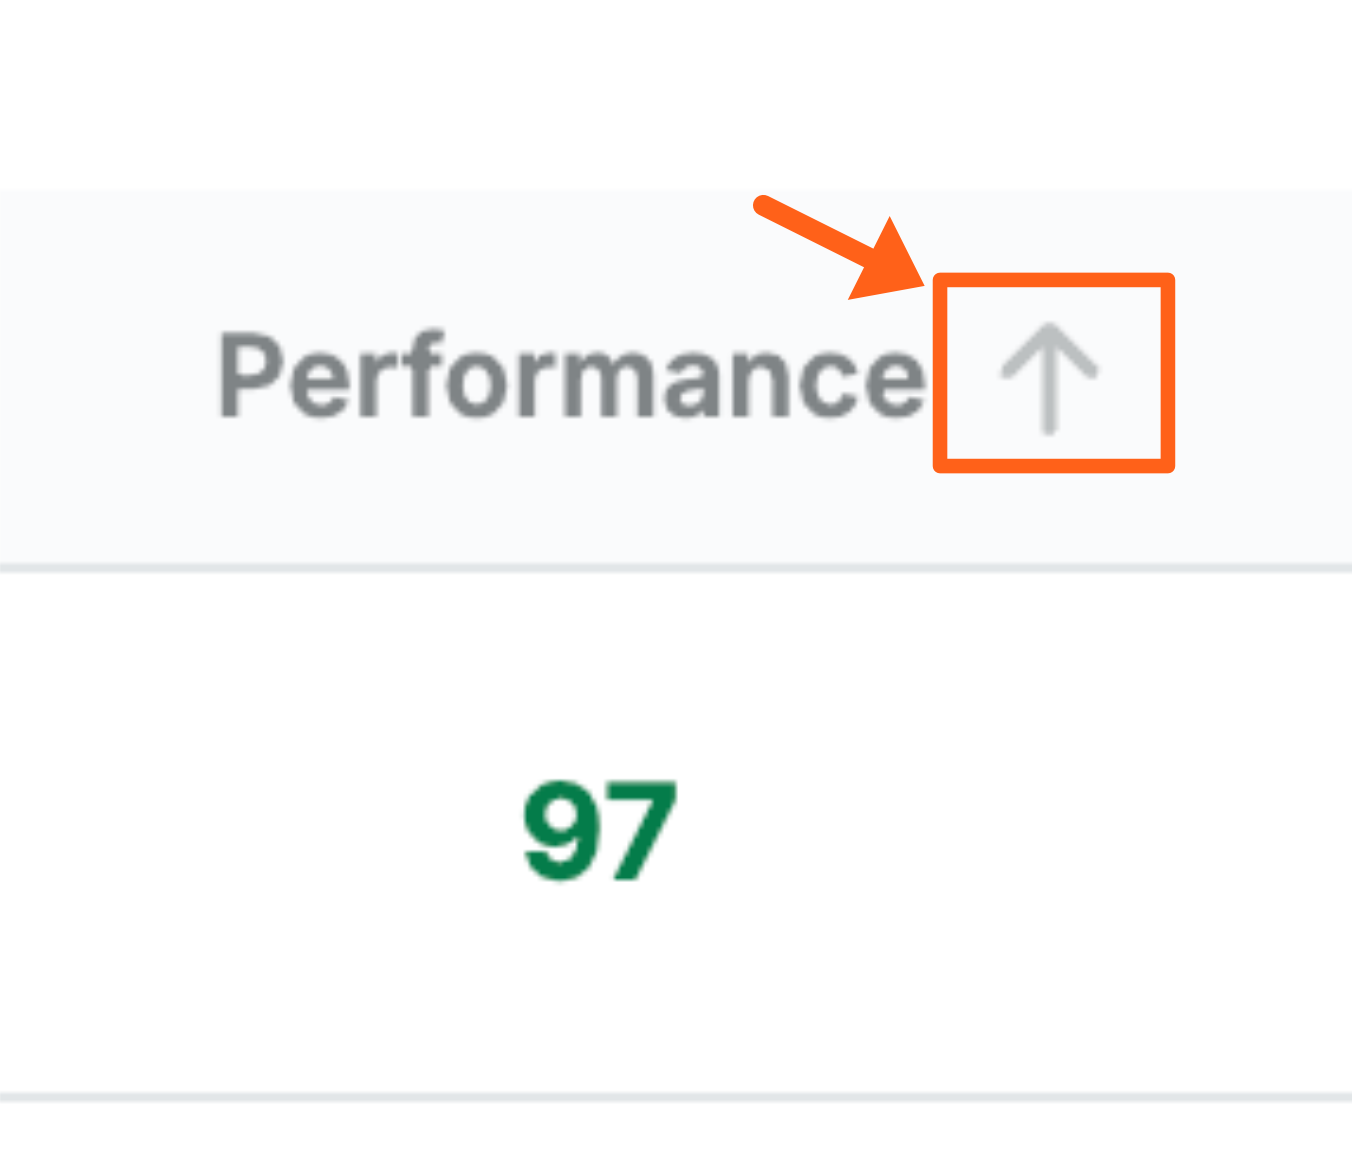
Activate Page Speed Boost
In the Page Speed Boost column you can see which environments have the Page Speed Boost product extension enabled and optionally enable it right from the overview table.
Google PageSpeed Insights
Google PageSpeed Insights can be used when benchmarking page performance, however we do not recommend using it as your only speed test. The test leverages a mid-tier device on a mobile network, meaning it tests your site for performance from a single device and fixed set of network conditions. Therefore a newer device, on a fast network, may not see your website the same way PageSpeed Insights reports.
Many people strive for a perfect 100/100 score on Google, whether it’s because a client demands it or because Google largely governs SEO so Google’s tool appears to hold more weight. However, it’s important to understand what the score means in terms of your business, alongside performance reports from a variety of other locations. Any green score (90-100) is considered Good, yellow score (50-89) is considered Average, any red score (0-49) is considered Poor.
Pagespeed Insights is designed as a series of guidelines (or “insights”), targeted around meeting specific standards that Google has deemed important for current and future readiness. A website can score perfectly on Pagespeed Insights, and yet still be largely unsatisfactory to the needs of your visitors. Many pages may never be able to receive a perfect score due to the specific needs or configuration. Instead, think of the PageSpeed insights tool as a guide for what Google thinks will improve your site performance by adhering to the newest generation metrics, and not as the final say on overall performance. We recommend placing less weight on the high-level Performance score, and largely focusing instead on the individual audit recommendations.
Improving your Google PageSpeed scores typically requires optimizations to be made across the board. These recommendations usually come back to a few categories: database, code, media, and assets. No audit directly impacts the overall Performance Score, which means you cannot focus on one or two audits and expect to see any real change. It’s best to review all of the recommendations Google provides, then implement all of the changes possible.
Performance Benchmark Test
Benchmarking pagespeed is a great way to determine the efficacy and performance of your WordPress website. As we discussed in “Optimizing WordPress for Speed and Performance”, one of the first steps to make a site faster is to measure how the site is currently performing.
We recommend using a combination of services as they will test from a variety of locations and server types, helping to build a more complete picture of a website’s performance. Some common examples include; WebPageTest.org, Pingdom, and Google PageSpeed Insights.
Having a more complete picture of a web page arms your team with enough information to target and correct issues efficiently across more browsers, more devices and more users.
PageSpeed Audits
There are an extensive number of audits PageSpeed Insights performs that can be broken down into 3 groups. These values do not directly impact the Performance Score, but rather are suggestions based on algorithms.
- Opportunities – Suggestions to improve metrics, with an estimated load time savings.
- Diagnostics – Extra information around best practices.
- Passed Audits – Audits the page has successfully passed.
As there are dozens of insights available under these 3 groups. It is best to simply click the suggestion in Google Pagespeed Insights for more relevant information as to how to address it.
For a full list of audits, refer to Google’s “Lighthouse” reference guide.
Field and Lab Data
Field data is data collected over time for the page and Lab data is data collected under a fixed set of conditions. Your website may not have any Field data if the page has not received ample traffic yet and it’s okay for these values to not match up exactly, as they were collected under different conditions.
The audits, listed lower on Google Pagespeed Insights, do not directly influence this score, however there are suggestions around each area that may help improve scores overall in more detail below.
First Contentful Paint
The amount of time until the first item is visually loaded. This is important because it confirms to the user the page is actually loading.
Improve FCP
- Minimize the number of render-blocking external stylesheets and scripts
- This can be done with several optimizations tools, such as Page Speed Boost.
- Reduce server response time
- Utilize a CDN (content delivery network) and reduce TTFB (time to first byte).
- Improve cacheability to speed up repeat visits.
- Minify and compress text-based assets to speed up their download time
- This can be done with several optimizations tools, such as Page Speed Boost.
- Eliminate Render-blocking JavaScript and reduce JavaScript load
- This can be done with several optimizations tools, such as Page Speed Boost.
For more information, see first contentful paint in Google’s references.
Speed Index
How quickly the contents of a page are visually loaded, in milliseconds. A lower time here is better, and to fully take advantage of this value you’ll want to use it as a comparison. This means you should measure the value relative to itself before and after optimization, or compared to your competitor’s measurement on a similar page.
Improve Speed Index
- Optimize images
- Images are one of the most overlooked elements of page speed. Reducing image size and optimizing image load can greatly improve page speed. Learn how to optimize images in WordPress.
- Minify code
- Reducing the number and size of files on your website will reduce the overall page weight. Lowering page weight will improve load times for all devices and networks.
- This can be done with a several optimizations tools, such as Page Speed Boost.
- Leverage caching
- WP Engine enables heavy caching by default. Additional caching layers can be leveraged to further improve load times. See our guide to learn more about improving cacheability.
- Use a CDN
- A CDN can geographically place larger assets closer to individuals loading your site’s content. This improves page speed by lowering the burden on the end-users device and network. Learn how to enable a CDN for WordPress.
- Optimize the database
- If the database is weighed down by excess or unoptimized content, every single request will be slower than it needs to be. Learn more about database optimization best practices.
- Practice responsible plugin and theme management
- Remove unused plugins and themes.
- Excess code can still be called and loaded on a page, even if the plugin or theme is inactive. Completely remove any items a website isn’t actively using.
- Keep plugins and themes up to date.
- For automated plugin update management, including post-update testing and restores, try Smart Plugin Manager.
- Remove unused plugins and themes.
- Limit external scripts
- External scripts are a common culprit for a slow-loading website because the assets are hosted externally and cannot be optimized or controlled from the same website. Limit the use of externally loaded scripts such as fonts, comment systems, iFrames or ad services.
- Use a lightweight theme
- Your theme and framework can have a large impact on performance because the assets are loaded on every page. As development languages progress (like with new versions of PHP), a theme will become less and less efficient. The Genesis framework and StudioPress themes are included with all WP Engine plans and come pre-configured for optimal SEO and site performance. Getting started with Genesis and StudioPress in 4 simple steps.
Time to Interactive
Refers to the first input delay, or the amount of time from a user interacting with your site to the site responding. If you’re not sure what’s causing this metric to be high, we recommend starting with basic WordPress troubleshooting to locate the offending area of code.
This metric is most commonly high on sites using a large amount of Javascript. Therefore, in order to improve this metric, inefficient code will most likely need to be rewritten or otherwise replaced. We recommend developing the code in the “idle until urgent” methodology to increase performance in this area.
For more information, see “time to interactive” in Google’s references
NEXT STEP: Learn about WP Engine’s Application Performance Monitoring
