Get Started


Key Takeaways
Understanding website capacity is crucial for performance. Monthly traffic metrics offer insights into baseline and peak traffic levels, but concurrent users are key for capacity planning.
Concurrent users define resource demand. They represent the total users accessing a site simultaneously, impacting performance and scalability.
Google Analytics active users differ from concurrent users. Understanding the distinction is vital for accurate capacity assessment.
Metrics hierarchy guides performance optimization. Users, sessions, and hits provide granular insights for improving site performance and user experience.
Gaining a clear understanding of your website’s bandwidth isn’t a simple task—this detailed guide examines the metrics you should be looking at to answer the question with confidence, once and for all.
Gaining a clear understanding of your website’s performance and capacity isn’t a simple task—in fact, it can be a rather arduous process if you don’t know how to approach it. This detailed guide examines the metrics you should be looking at to answer your site traffic questions, with confidence, once and for all.
At WP Engine, we know website performance is more than just a one-dimensional catchphrase. In fact, when it comes to the sites that run on our platform, we view performance as a strategic equation that combines aspects of our cloud and security solutions with our managed hosting expertise.
In doing so, we’re able to approach performance as it should be approached, from multiple angles, with a laundry list of variables and metrics that need active support.
We also view these efforts as a product in their own right, and one that’s never finished—we’re constantly working on ways to improve all components of site performance across our platform. By taking this “never satisfied” approach, WP Engine is able to help our customers build some of the fastest sites on WordPress, and we’re able to help them keep those sites up and running in the face of everything from traffic spikes to security threats.
While we cover speed and metrics such as Time to First Byte (TTFB) here, the following article offers a deep-dive on traffic metrics and the common, albeit crucial question: “How much traffic can my site handle?”
Framing the question.
Website capacity, i.e., the amount of traffic your site can handle at any given moment, is a key component of overall site performance, and it has direct impacts on KPIs as well as how much time developers spend on things like infrastructure (if you’re managing your own infrastructure in-house). That said, gauging how much traffic your site can handle truly begins with understanding the types of users and traffic your site receives.
First, let’s explore the definition of concurrent users, within the context of the Internet.
The number of concurrent users refers to the total number of users simultaneously accessing a resource. These resources can be a web or mobile application, network, or file.
At WP Engine, this resource is your WordPress site.
It’s worth noting that concurrent users is a high-level metric. In the next few sections, you’ll learn that concurrent users lead to a more granular metric of concurrent requests. Since these requests come in different shapes and sizes, we can use cacheability to understand how a site performs at scale. As we go deeper, we’ll explore how concurrency and cacheability interact with one another.
So how do you use concurrent users to understand the capacity of your environment? Before we can answer this, let’s go back a step further, and look at one of the most common metrics used today: monthly traffic.
Monthly traffic metrics: Are they helpful?
Generally speaking, yes. Month-to-month numbers provide an understanding of the basic traffic profile: low, moderate, or high. These metrics also provide insights into any potential trends, patterns, and seasonality, as monthly traffic can change based on many variables including marketing campaigns, search engine rankings, and market conditions.
For most sites, the normal, day-to-day traffic can be fairly stable and predictable. We can call this baseline traffic. However, some sites that experience recurring traffic spikes aren’t worried about the baseline. They’re more concerned with high traffic events that are critical to their business, such as a site that sells concert tickets or a site used to announce product releases. When these events matter the most, it’s important for your production environment to handle not only baseline traffic but peak traffic levels as well.
This is where monthly traffic numbers won’t help. The more reliable metric for understanding capacity at this, (but really any) traffic level is concurrent users.
Diving deeper into user metrics.
Before jumping into concurrent users, it’s helpful to understand the hierarchy of metrics in the realm of digital analytics. Here’s a diagram to illustrate this:
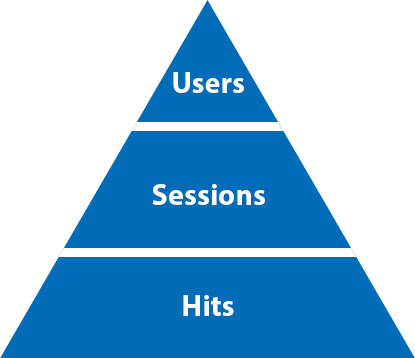
- Users or visitors are metrics that describe a user entering the site for the first time. It’s typically defined by a unique user ID. At WP Engine, it’s defined as a unique IP address and counts as a single unique visitor per day. Since any additional visits by the same user are recognized by a unique user ID, the unique user would only be counted once.
- Sessions or visits represent a period in which a user engaged with the site. The session starts when the user first visits the site and ends when either three things happen: the user closes the browser, clears cookies, or becomes inactive for 30 minutes (which is the default period in Google Analytics and can be customized). A single user can have multiple sessions over the course of the day.
- Hits are the interaction between the site and a defined resource. On the digital analytics side, this metric is defined as data being sent to Google Analytics. These hits are most commonly page views. Within the WP Engine context, a hit can be a request to the production environment. These requests can either be cacheable like static assets (pngs, jpegs, pdfs) or dynamic like database writes (registrations, publishing posts, product orders).
Based on the hierarchy of these metrics, as you move from top to bottom, the data becomes less ambiguous and more granular. At the same time, understanding the impact these metrics have on performance becomes more clear.
In short, knowing the number of monthly users or visitors is not enough.
What about Google Analytics active users?
There’s often a misunderstanding regarding the way Google Analytics and WP Engine capture and define metrics. In simple terms, both are tracking this data for different purposes. Google Analytics is primarily a marketing and conversion analytics tool. In contrast, WP Engine is a managed platform that tracks raw resource utilization at the infrastructure layer and performance at the application layer. The methodologies are different and can cause discrepancies between both platforms.
As it relates to concurrency, Google Analytics offers real-time reports that monitor the effects of marketing campaigns on your site. This includes the number active users on your site right now:
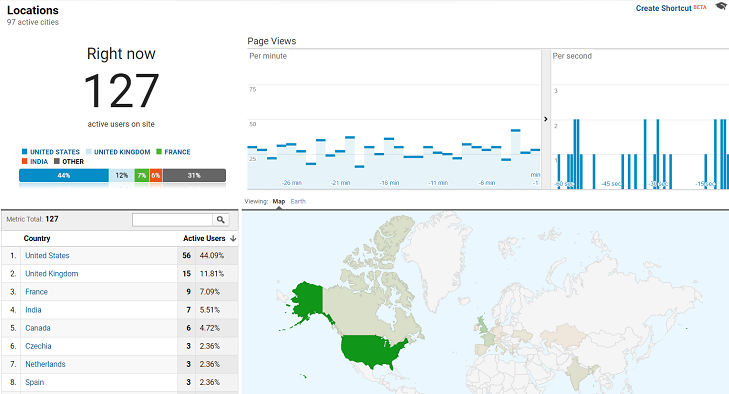
Despite being “real-time,” this metric doesn’t quite measure the total number of users on your site at any given moment in time, simultaneously. A real-time active user is defined as a unique user who has triggered an event or page view within the past five minutes. If a user leaves the site before the five minute window, Google continues to count this as an active user. If a user stays on the site longer than 5 minutes, they are no longer counted as an active user even though they’re still interacting with the site.
With this in mind, Google’s active users could be more than the actual number of concurrent users on your site. And in less common cases, the metric could be less than the actual concurrency depending on user behavior and average session duration.
Can you rely on Google Analytics Active Users? As always, the more data you have, the better. But alone, it doesn’t determine your capacity needs.
How to measure concurrent users.
If Google Analytics doesn’t provide a clear metric for concurrent users, then what does? Here are two common methods to help you determine this number:
1. Calculate concurrent users.
By using this formula with data pulled from Google Analytics, you can calculate the number of active users on your site within a very small unit of time, such as a second:
[Peak Hourly Sessions X Average Session Duration (secs)] / 3600
For peak hourly sessions, go to the “Audience Overview” report in Google Analytics —> find the period of peak traffic —> change the tab to “Hourly” —> hover over the graph to see the highest number of sessions within an hour.
For the average session duration, the metric is shown within the Overview dashboard. If it isn’t, go to “Select a metric” under the Overview tab to display the duration.
2. Choose a Google Analytics alternative.
Although Google Analytics is the most popular web analytics tool in the space, it may not meet all of your specific needs. There are a great number of analytics tools that can measure concurrency more aligned with the traditional definition of concurrent users.
What about cacheability?
So, are concurrent users a valid measurement of performance? Not completely. This metric helps you understand the magnitude of the scenario at a high level but doesn’t provide deeper insight.
That said, it’s helpful to understand the difference between users that are logged into your WordPress site (members, admins, editors) and users that are not logged in. The behavior of these users produces different types of “hits” or requests, which are most indicative of site performance (mentioned in an earlier section above).
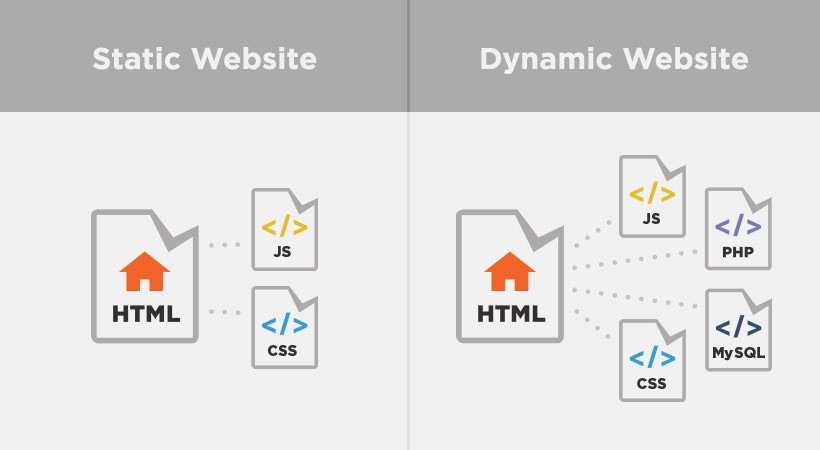
To expand on this, these different types of requests come in the form of either static or dynamic:
- Static content (files which rarely change) like CSS, JS, and images for example, are easily cacheable.
- Dynamic content like login pages, shopping carts, and membership-only areas are not cacheable because they require the screen to show something unique to each person visiting it.
This brings up the concept of cacheability, which refers to the process of storing data in a cache, or temporary storage area. When content is cached, a browser can retrieve it from the cache rather than the original server, saving the end-user time and saving the network any additional traffic burden.
Cacheability is simply the percentage of visits to your site that are cacheable, compared to those which are uncacheable.
When WP Engine users are logged into their WordPress site, they’re interacting with dynamic content that is almost completely uncacheable. Therefore, it bypasses our frontend caching layers like Varnish and CDN. As a result, these uncacheable requests are typically more resource-intensive as they have to be newly processed in the backend via PHP and MySQL. Meanwhile, sites that don’t require a login can vary in cacheability depending on the elements on the page.
This diagram illustrates the different technologies required to serve static vs. dynamic content:
To illustrate, let’s say we have a puppy adoption website called “The Puppy Nursery.” As a new visitor entering the site, you are suddenly engaged with high-quality photos on the home page. After hovering over the menu, you decide to click the puppy bios page for more detail about each animal. These pages are mostly static with descriptions and photos of cute puppies. Since these pages have mostly static content (cacheable), this particular user session is not very resource-intensive.
Now, after a day, you decide to visit the site again with the intention of adopting a puppy. You click on the registration page which dynamically pops up with a list of puppies closest to your geographical location. After choosing a puppy, you proceed to complete a form with personal contact details, agree to a safety waiver, and provide your credit card information for the adoption fee.
Upon hitting submit, you’re redirected to a “Thank You” page. This particular user session is more dynamic due to the interactive elements including the personalized pop-up, form submission, and credit card transaction. As a result, it’s more resource-intensive.
As this example shows, the variation in user sessions results in different types of requests and the number of requests to the server. These requests are better indicators of capacity and performance than the number of concurrent users alone.
Overall, the number of concurrent logged-in, logged-out users and cacheability helps you understand the resource demand of your site.
The different types of sites.
Clearly every website is unique and faces different challenges. However, it still holds true that the basic characteristics of a website will inform you of its cacheability.
Expanding on this concept, here are the different types of sites that are commonly more static or dynamic.
Static:
- Brochure sites
- B2B marketing sites
- Nonprofit organizations
- Blogs (low post activity)
- Any site with very low user interaction
Dynamic:
- eCommerce stores
- Membership sites
- WordPress Multisites
- Learning Management Systems
- Any site with high user interaction (comments, registrations, order transactions, logged-in activity, search queries)
Note: Although these are categorized as such, your WordPress site may have both static and dynamic elements. That’s why, when looking at your cacheability score, it’s important to understand the ratio between both.
Now let’s translate this to traffic. Imagine a scenario where you have two types of sites: brochure and eCommerce. By nature, the brochure site is more static than the eCommerce store. Respectively, we’ll say the cacheability score of each site is 90% and 20%. If your site is hosted on WP Engine, reach out to our Support Team to determine your cacheability score.
In this scenario, let’s say you’ve decided to use a Google Cloud dedicated solution on WP Engine’s platform for each site. Assuming the solutions are exactly the same, how much traffic can the brochure site handle before it goes down? How about the eCommerce site?
As you now know, the answer depends. Generally speaking, the brochure site on the dedicated solution could support significantly more visitors per month than the eCommerce site. It’s simply more static and cacheable. That’s a relatively safe assumption we can make.
As far as knowing the exact number of visitors your site can handle, we recommend approaching this question holistically by breaking it up into smaller parts.
Asking the right questions.
Instead of determining how much traffic your site can handle, perhaps the more helpful question may be…
How many concurrent users can my site handle over the duration of a given time during a realistic high traffic scenario? For example, your site will be featured on a TV show and you expect 1,000 concurrent non-logged-in users for 20 minutes.]
How many of these users are logged-in vs logged-out?
How cacheable is the site?
What is an acceptable level of response time, requests per minute, latency and error rates during this peak load?
And as it translates to the business, what happens if these KPIs are not met?
How might that impact revenue?
Enter load testing.
To answer these questions, we highly recommend performing a load test to simulate the real scenario.
While a Page Performance test (available to WP Engine customers) or a Speed Tool test (available to everyone) measures the speed of a site based on a single visit, that’s only the first chapter. The load test tells the whole story.
Most commonly, a load test is performed to simulate peak traffic with a high number of concurrent users. In other words, how does the site perform under heavy load and not just a single visit.
To truly understand the capacity of your environment specifically for your site, doing a load test will give you more confidence at any level of traffic.
Here are some resources to help:
For a deeper dive into load testing, please see this whitepaper.
For tips on improving page cacheability, refer to this article.
Final Thoughts.
Understanding how much traffic your site can handle can certainly be confusing. Most managed hosting providers define their own criteria and maximum monthly visitors for their solutions. Since your site has a unique set of characteristics, it’s not realistic to trust these numbers to evaluate performance and capacity. And remember, monthly traffic numbers won’t help you understand how your site will handle a high traffic event, even one that might only last for a short period of time.
That’s why these estimated numbers should only be used as guidelines. You can make a better informed decision by asking the right questions, evaluating the right data, and if necessary, performing the right tests.
As a final note, traffic is just one part of the performance puzzle and it’s just one determining factor when choosing a solution and a platform. Other factors include caching layers, database performance, quality and design of infrastructure, high availability, and scalability.
Every business has different needs. For enterprise customers, there are critical business and functional requirements that need to be met.
According to the pillars of the AWS Well-Architected Framework, these are the highest priority:
- Operational Excellence: The ability to run and monitor systems to deliver business value and to continually improve supporting processes and procedures.
- Security: The ability to protect information, systems, and assets while delivering business value through risk assessments and mitigation strategies.
- Reliability: The ability of a system to recover from infrastructure or service disruptions, dynamically acquire computing resources to meet demand, and mitigate disruptions such as misconfigurations or transient network issues.
- Performance Efficiency: The ability to use computing resources efficiently to meet system requirements, and to maintain that efficiency as demand changes and technologies evolve.
- Cost Optimization: The ability to run systems to deliver business value at the lowest price point.
WP Engine follows industry standard practices that are aligned with these pillars.
Want to find out more about how much traffic your site can handle? Click here to find out more about WP Engine’s plans and the benefits customers see when they utilize our managed hosting platform for WordPress.